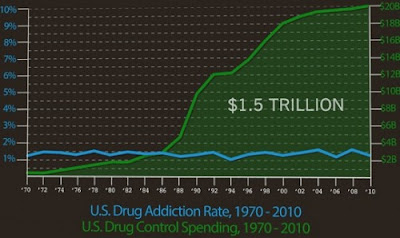
Let this graph sink in:

Source
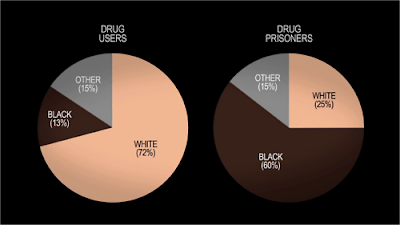
And then combine it with this pie chart:

Source
And remember -- ex-felons increasingly are not allowed to vote. I really must read Michelle Alexander's The New Jim Crow: Mass Incarceration in the Age of Colorblindness.
Wednesday, October 17, 2012
Two Graphs
Posted at
2:10 PM
![]()
![]()
Categories: (Mis)Informed
Subscribe to:
Post Comments (Atom)


No comments:
Post a Comment