
A MAGA friend has been going off on Facebook about how Illinois is so gerrymandered, as an excuse for what Texas Republicans are trying to do.
I looked into the disproportion of the overall Illinois 2020 presidential vote, compared to its number of Congressional reps by party, and it's clearly the result of gerrymandering in the Democrats' favor. Though it was done in the appropriate year (after a census), unlike the current illegal action in Texas.
However, this map puts the Illinois disproportion in perspective:

To summarize what that map shows:
Blue states (states that voted for Biden and Harris) have
- 11 with green status (WA MN MI NY MA CT RI NJ VA DE CO)
- 2 with yellow status (CA ME)
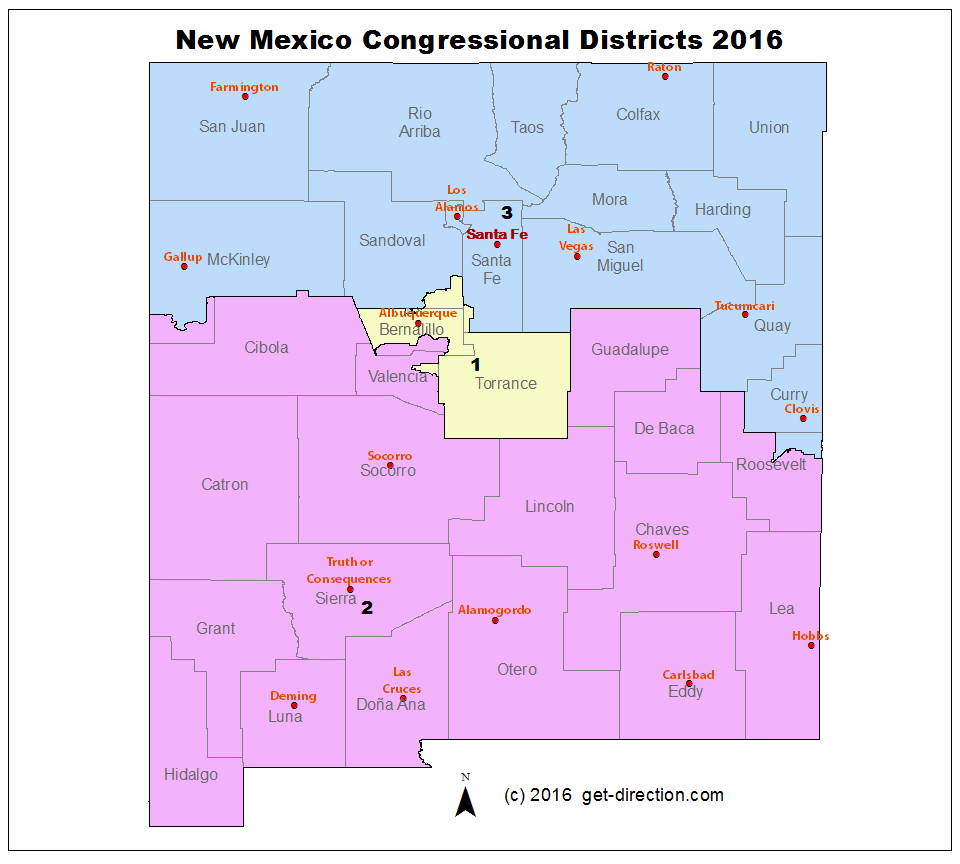
- 3 with red status (OR IL NM)
Purple (tossup) states have
- 1 green (AZ)
- 2 yellow (PA NH)
- 3 red (NV WI GA)
Red states:
- 9 green (ID MT WY SD NE MO IN KY AL)
- 1 yellow (IA)
- 3 orange (OK AR MS)
- 8 red (UT TX KS LA TN NC SC FL OH)
There was insufficient data for
- 3 red states (AK ND WV)
- 2 blue (VT HI)
I have to say — not that I am an expert on the geography and demographics of Oregon or New Mexico — but I don't see their maps as looking particularly gerrymandered, compared to the one from Illinois, or a lot of the ones in red states. They look pretty contiguous and appropriate to me.
It was good to see so many nongerrymandered "red" states. Though — notably — they tend to be where there are significantly fewer Black voters (except Alabama, which is currently in litigation over racial balancing).
Regardless of those green red states, it does stand out that red states are much more likely to be red or orange on this map — more than half of them — while for blue states, it's under 20%, even including New Mexico and Oregon.

No comments:
Post a Comment