
If you've ever seen one of those county-level presidential voting maps, this may look familiar:

What's up with all of those red counties across the South, except that curving belt of blue? I've always assumed those counties had more black people, but I didn't think too much about why until I saw this tweet by Nick Baumann today:
See the blue belt on the Obama/Romney map? That's Cretaceous coastline. Fertile soil later led to high cotton production + high slave population.And that high enslaved population led to a higher number of black voters today.
Here's a map, also by county, showing the concentration of enslaved populations in the 1860 census:
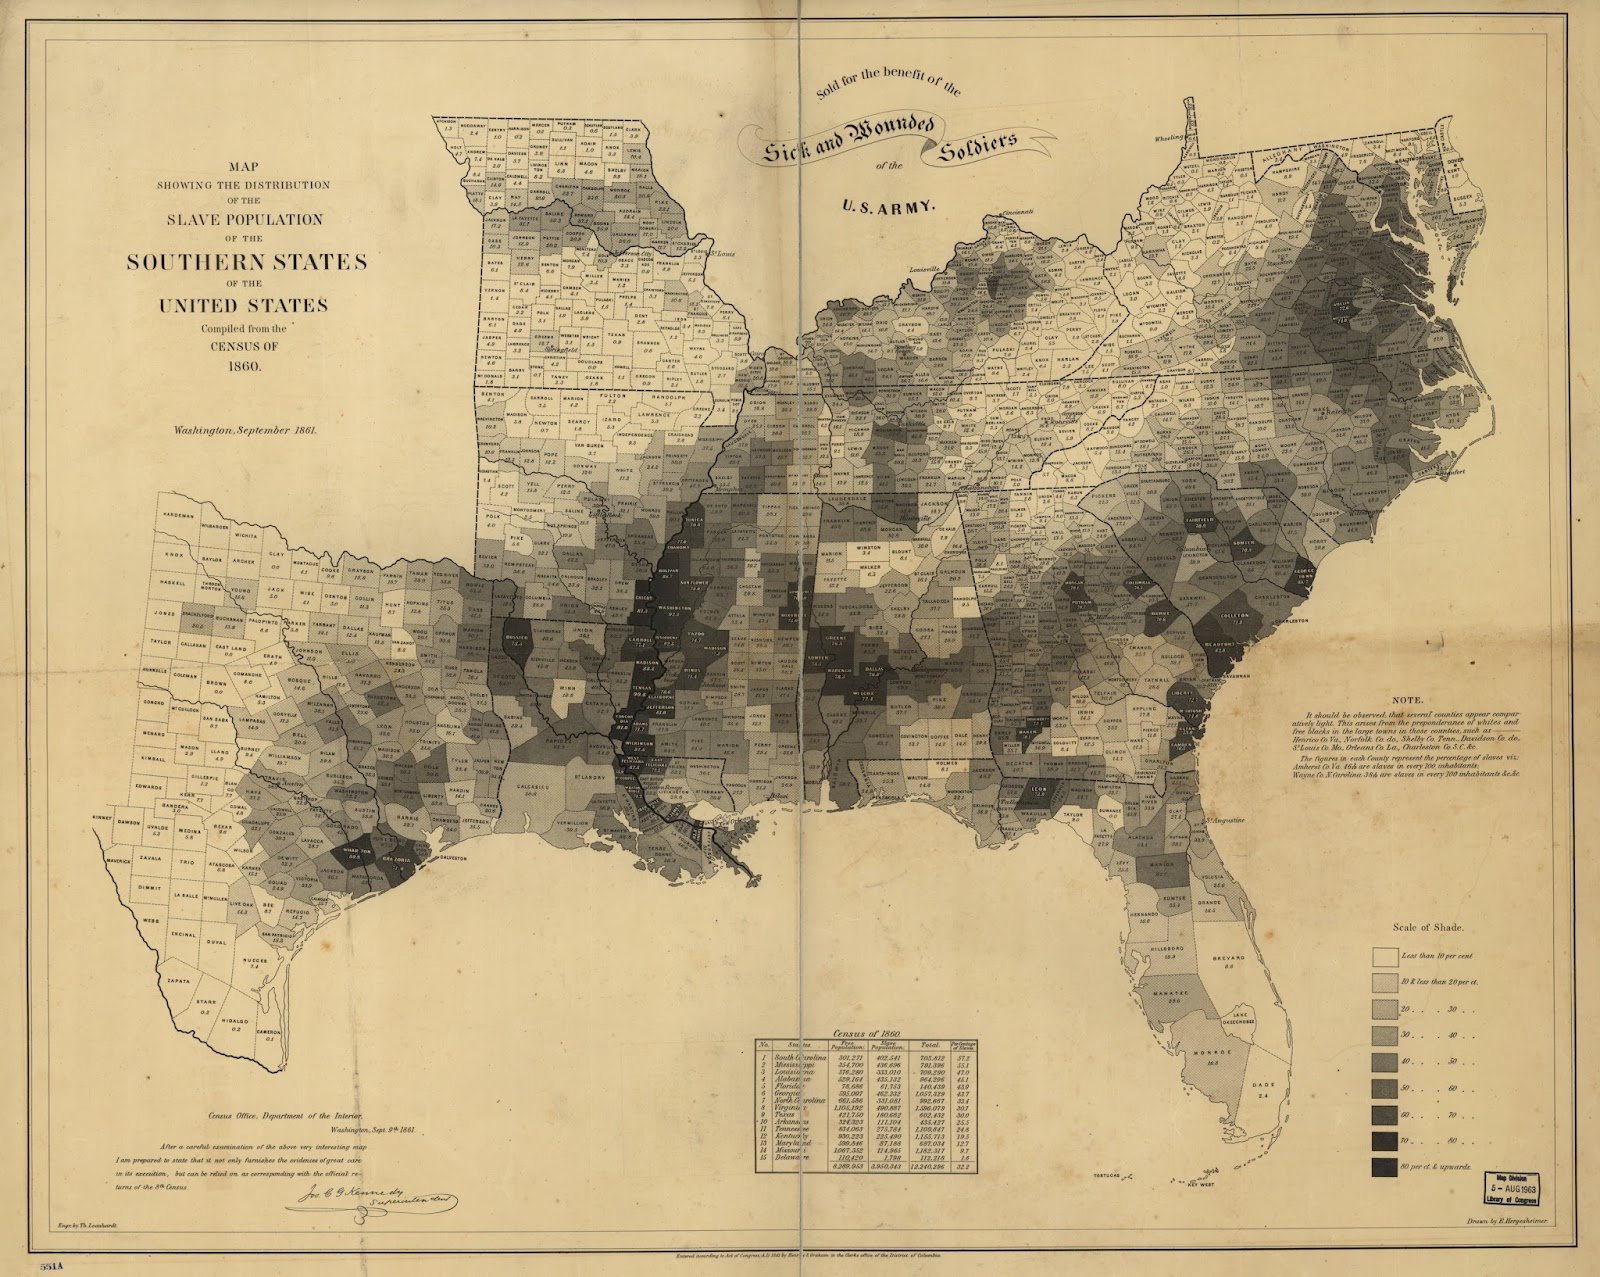
It's not completely one-to-one, but I'd be willing to bet the counties that were black or dark gray in 1860 and are now red are ones where black people were run out of the county during Reconstruction or had extra-large outflows of black people during the Great Migration in the early 20th century.
But you can definitely see that most of the blue counties today were among the black and dark gray counties on the 1860 map, even though the white people in those counties are the least likely to vote for a modern-day Democrat.

1 comment:
You are a never-ending source of fascinating information!
Post a Comment